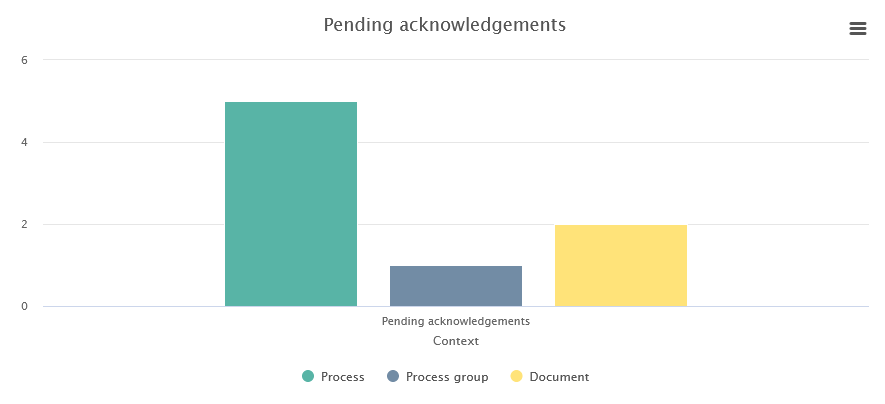
Column chart
The column chart visualizes data in vertical representation. With the column chart you optimally visualize event dimensions. You can display various detailed information by placing the mouse cursor over one of the columns.
Column charts in horizontal representation are bar charts.

