Process Views
When you open a process in the Portal, it opens in the Default view.
Siehe auch: For information on how to open processes, see Open model content.
Default display in the General tab
The General tab contains the default display of the process. The description and diagram of the process are displayed here.
Hinweis: If no description has yet been defined for the process, you can add one via the Properties sidebar.
Hinweis: If no diagram has been created yet, you can create a BPMN diagram for the process using the Create new diagram button.
Siehe auch: Under Configure tab views you can find out how to disable the default display.
Select and navigate objects in the diagram
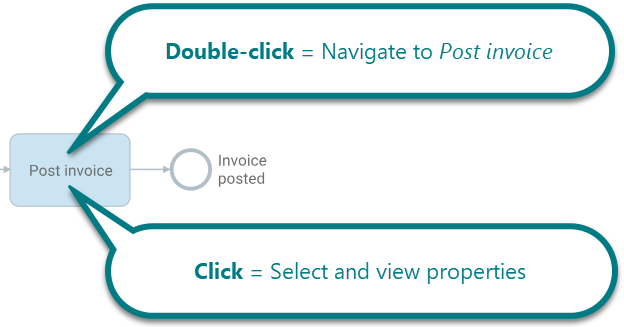
In the diagrams of your processes, double-clicking allows you to navigate, while single-clicking allows you to select and view properties.
Drop-down views
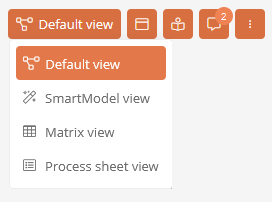
You can open the process in other views via the drop-down menu in the content area. Here you can also always see in which view the process is currently displayed.
Siehe auch: Under Configure drop-down views, you can find out how to create your own drop-down views.
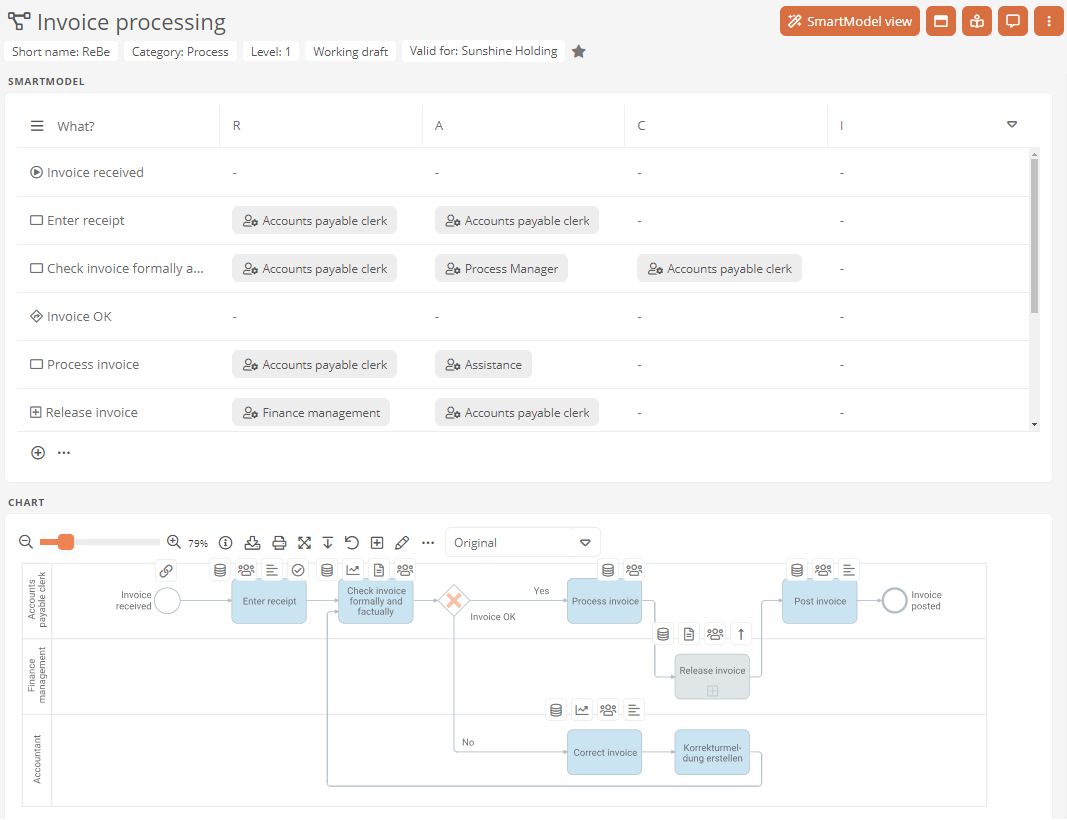
In the SmartModel view, the process is displayed in a table. Here you can further model the process in the table. The diagram below will be adjusted automatically.
Siehe auch: To learn how to model a process in tabular form in the SmartModel view, see Modeling in manual mode.
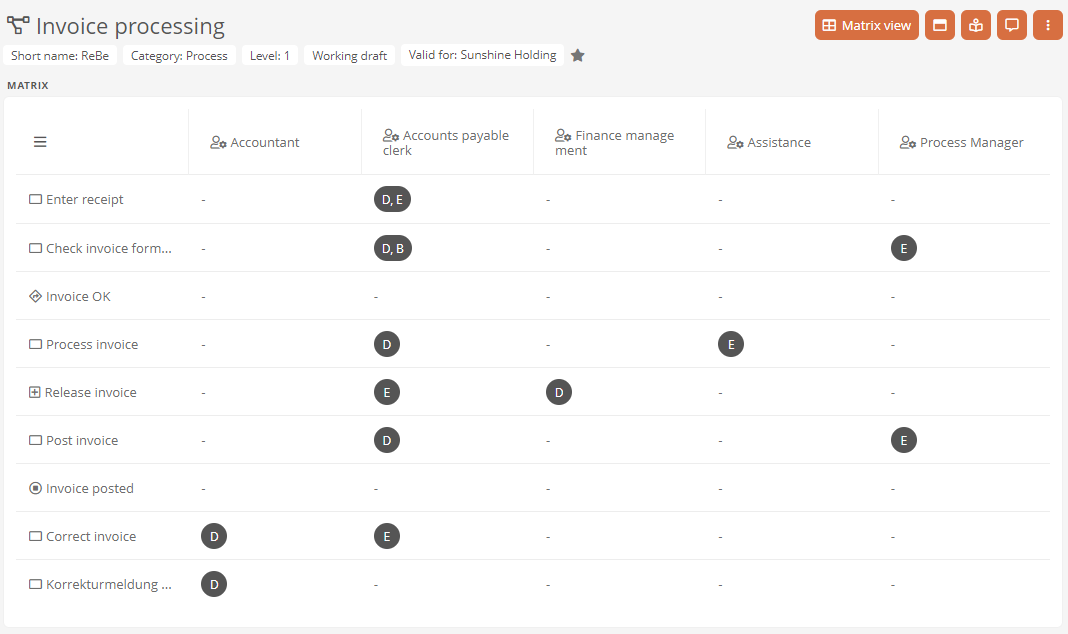
In the Matrix view, the process and its responsibilities are displayed in a matrix. Here you can edit the responsibilities (implementation, decision, consultation and information) and thus determine which role in the process assumes which responsibility.
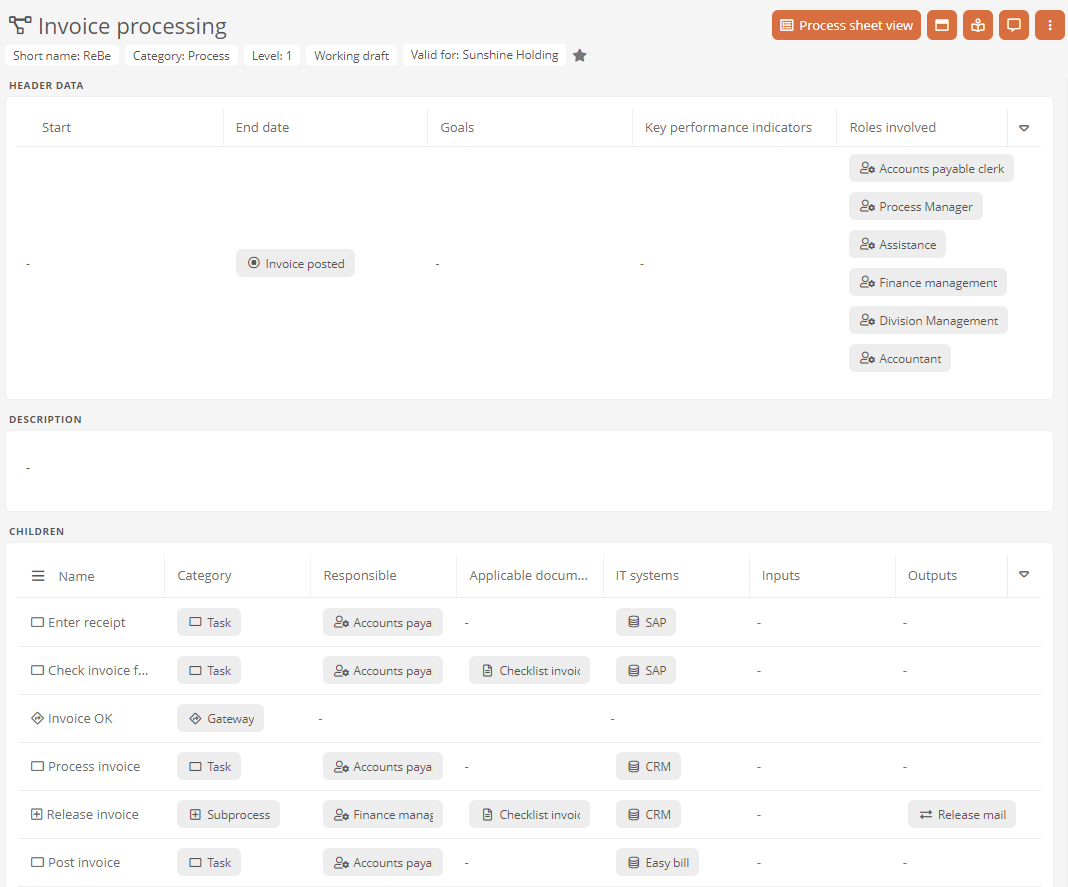
The process sheet view displays the key data of the process in tables and the description of the process.
Turtle view
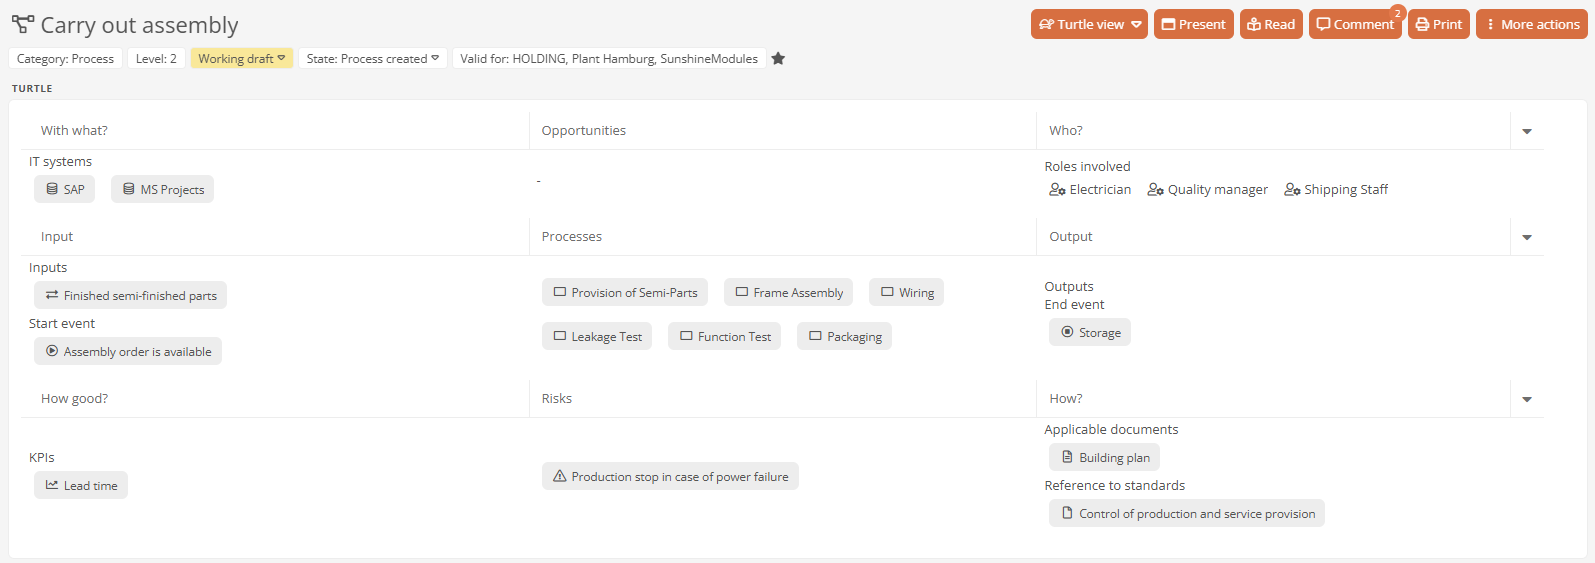
In the Turtle view, the input, process, and output—as well as the associated roles, resources, key metrics, risks, opportunities, and applicable documents for the process—are displayed in a matrix.
Process analysis view
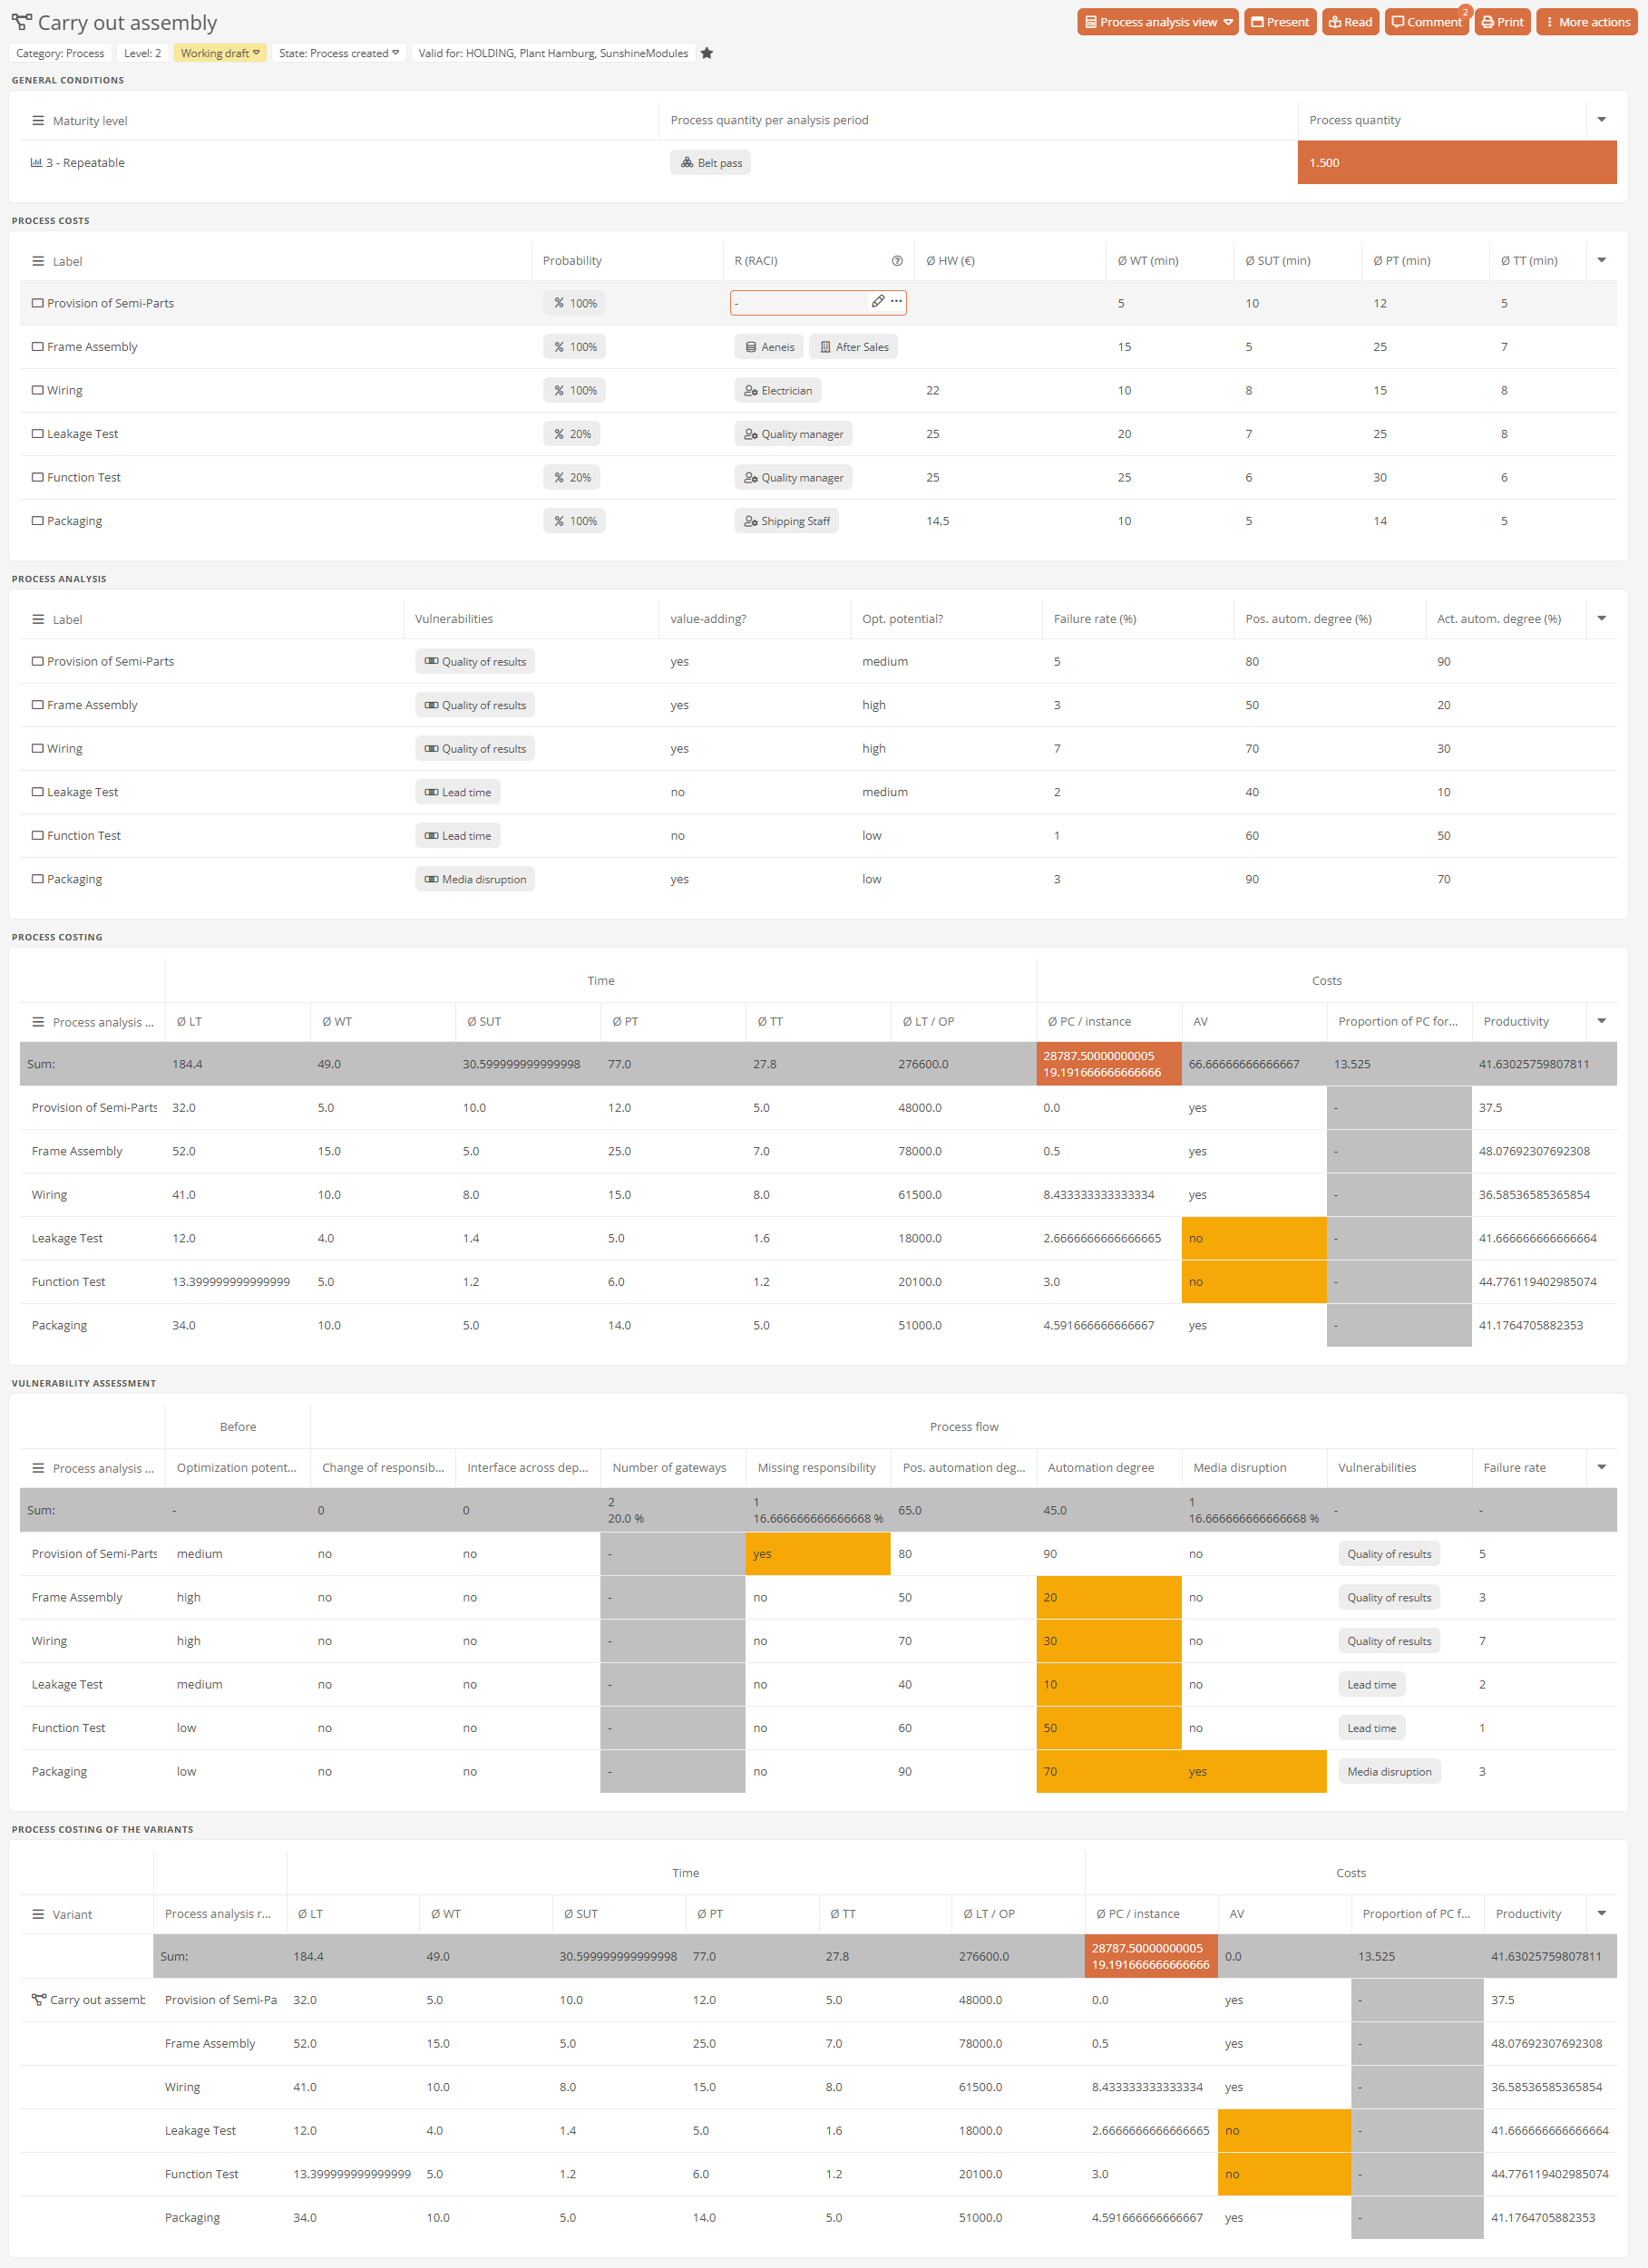
In the process analysis view, Aeneis analyzes the key metrics related to costs, lead times, bottlenecks, and the degree of automation for the currently displayed process in various tables.
Siehe auch: Process analysis view
App-specific process views:
Depending on your license, the following app-specific process views are available to you:
-
ISMS view
-
Audit view
-
ICS view
-
BCMS view
Full screen modes
You can view processes in presentation and read mode.
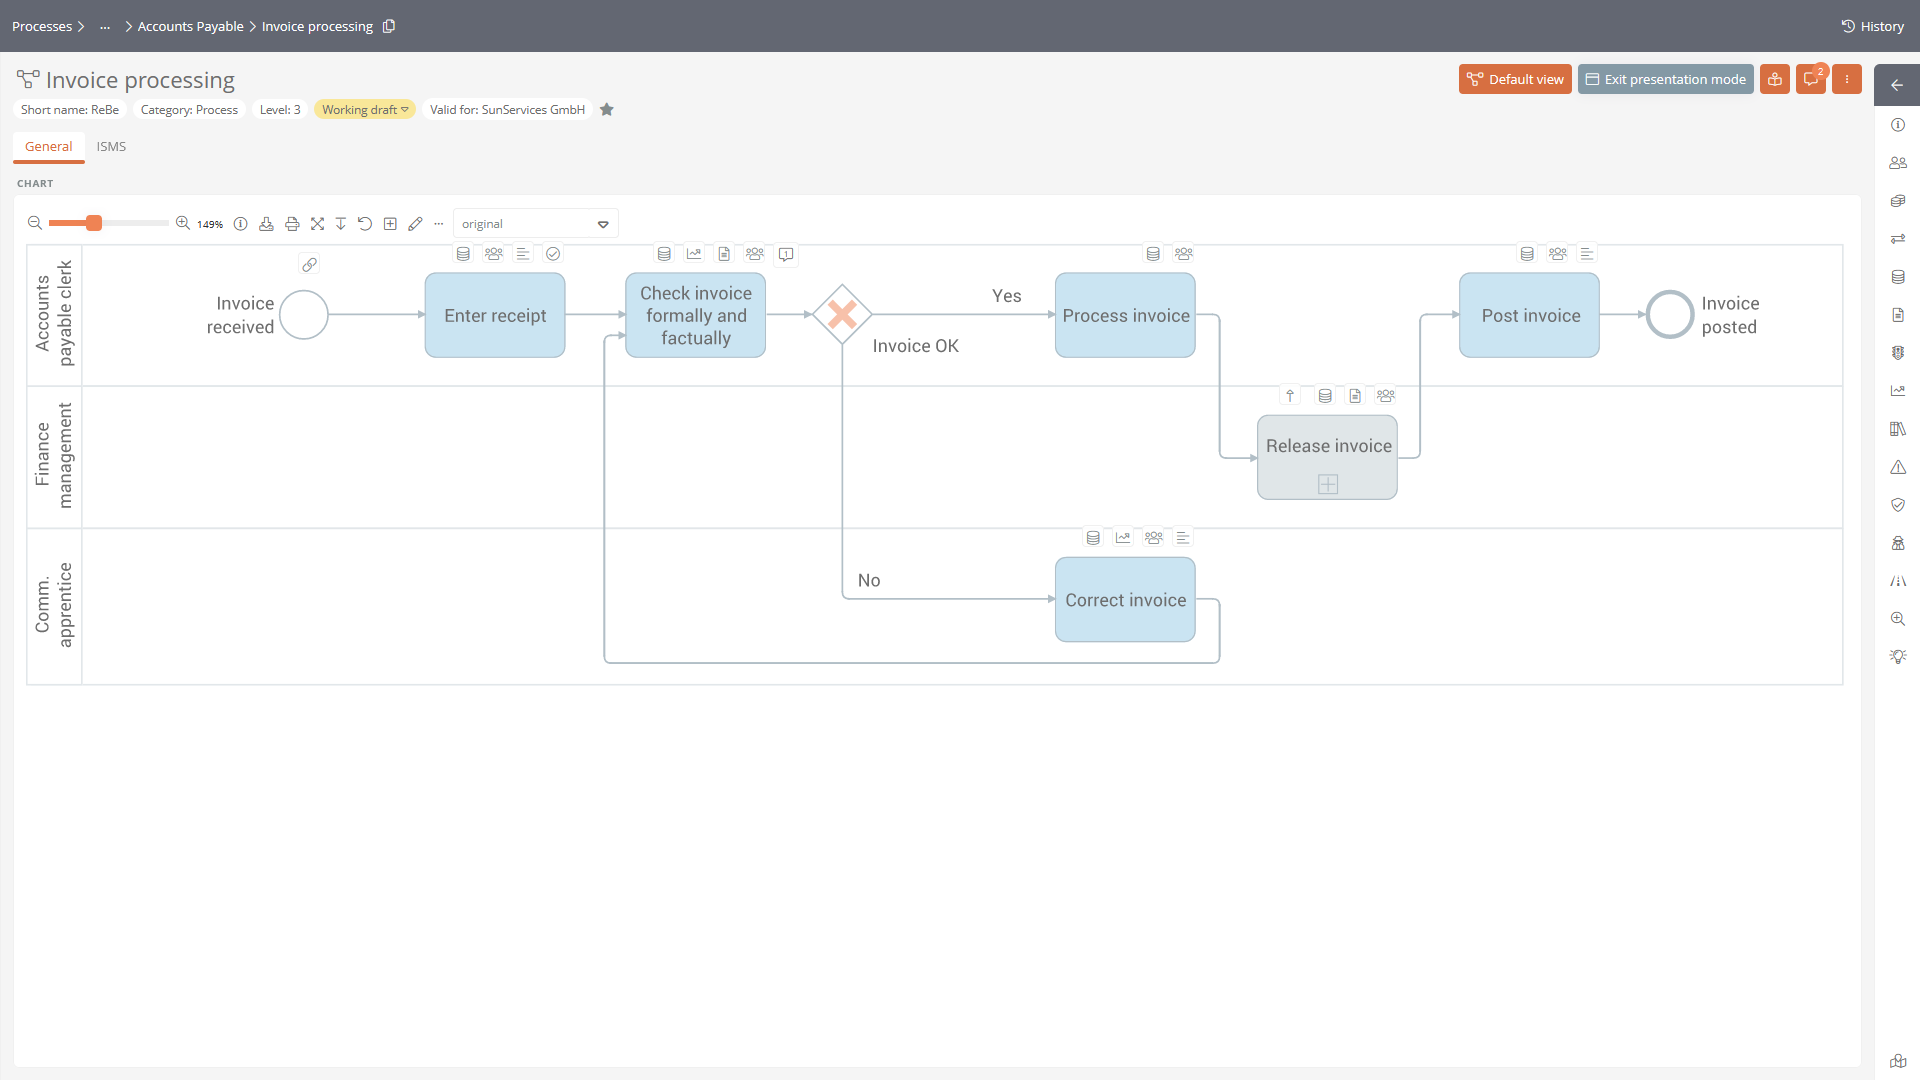
In the Presentation mode, the object is displayed with its essential information in full screen. In the Presentation mode, processes, the entire process organization, and the organizational structure can be presented without distractions.
In the Read mode, the process is displayed in full screen, where you can navigate through the process using buttons at the bottom and take a close look at each process step.
