
Configure column charts
Column charts are representations of the subordinate structures of objects that are created and laid out automatically. The subordinate structure is displayed on a maximum of four levels.
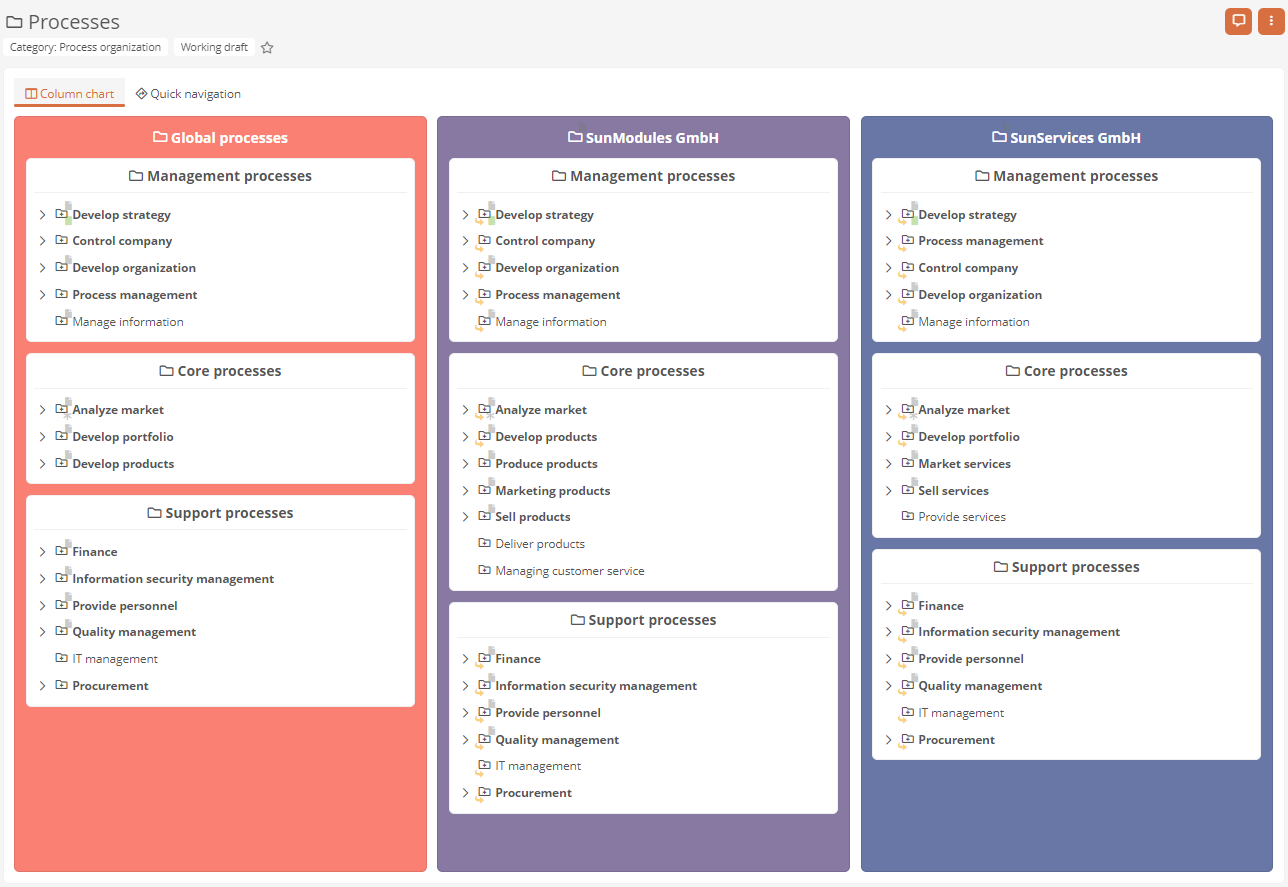
Column charts are automatically created in the Portal for process organizations and process folders. These default column charts show which objects and variants have been created up to process level under the process organization or process folder.
Note: If a freehand diagram is stored for the respective process structure, the column diagram and the freehand diagram are each displayed in separate tabs.
Note: In default views that contain a OneWorldMap, a column chart matching the context object is displayed below the OneWorldMap.
Enable column charts
You can enable or disable the automatic creation of column charts either in the Portal via the Global Settings or via the properties of the Portal report.
Define colors of the column charts
You can define the colors for the individual columns of the column charts yourself in the Portal report.
See also: To learn how to define the colors for column charts, see Portal report properties - Column chart colors.
Create and configure custom column charts
You can create and configure custom column charts for any categories using diagram boxes.
Tip: Custom column charts are particularly suitable for displaying master data pools and folders.
See also: How to create your own column chart in a chart box is described in detail under Configure diagram boxes.
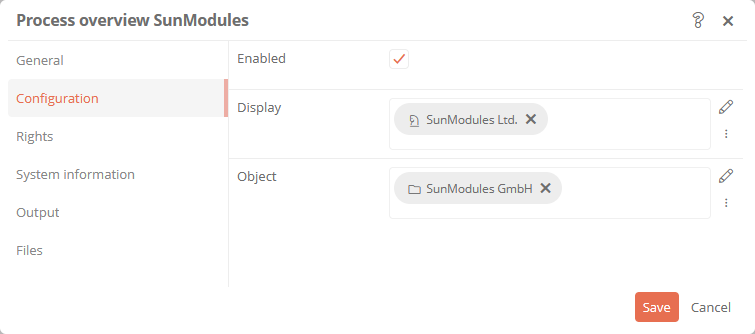
If you have created your own column chart, configure it as follows:
| Property | Description |
|---|---|
| Enabled |
Enabled: The column chart is displayed in the Portal. Disabled: The column chart is not displayed in the Portal. |
| Display |
Categories can be referenced under this attribute. This can limit the visibility / execution. Most application scenarios require category and access control related visibility. The logic of the evaluation is as follows:
If this logic is not sufficient, a differentiated logic can be configured via the condition components. |
| Object | Reference an object or query here for which a column chart is to be created and displayed. |
| Allowed categories | Here you can define the categories whose objects are to be displayed in the column chart. |