Homepage of the Data Protection app
The following access options and overviews are displayed on the homepage of the Data Protection app:
-
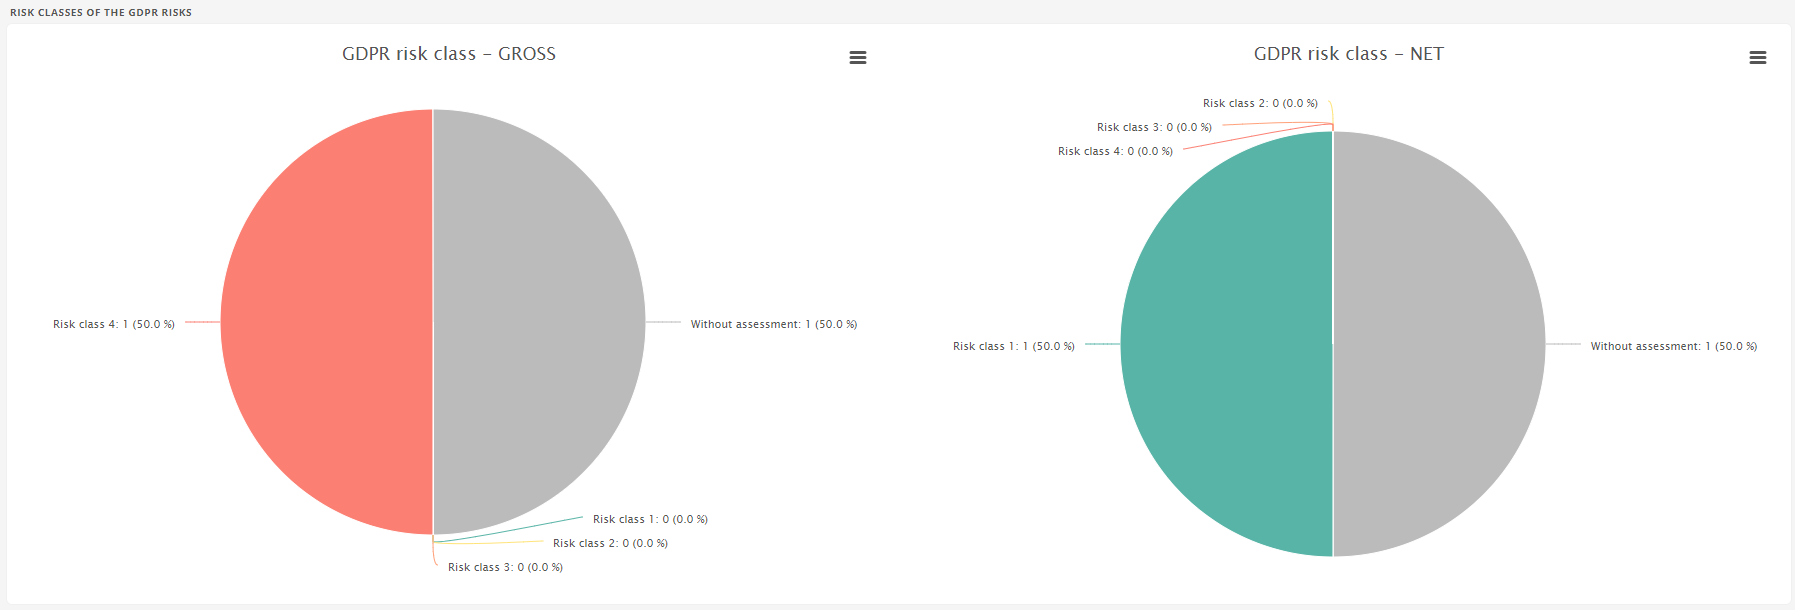
Risk classes of the GDPR risks
Note: The homepage displays only the content that is relevant to you and that you have access to.
Quickstarts
You can create the following central objects of the Data Protection app via the quickstarts:
Risk matrix
On the homepage, under Risk matrix, you can see how many risks there are, their occurrence probability and their impact. The left-hand matrix shows the risks before treatment and the right-hand matrix after treatment. The different colors indicate the severity of the impact and the level of occurrence probability. The numbers show how many risks there are with the respective classification.
-
The green area shows the number of risks whose occurrence probability and impact are low.
-
The yellow area shows the number of risks whose occurrence probability and impact are normal or somewhat increased.
-
The orange area shows the number of risks whose occurrence probability and impact are high.
-
The red area shows the number of risks whose occurrence probability and impact are very high.
Example: If three risks have a normal occurrence probability and a high impact, a three is output in the corresponding cell in the matrix.
Risk classes of the GDPR risks
In the Risk classes of the GDPR risks section, the risks before their treatment (GROSS) and after their treatment (NET) are each shown in a pie chart with your classification. Clicking on a value in the pie chart opens the entire list, from where you can navigate to the risk.
See also: Risk Dashboards


