
Customize the layout of diagrams
You can adjust the layout of a diagram in the WebModeller in the diagram properties in the Layout and Drawing Settings areas.
Instruction — Open settings:
-
Open the WebModeller and select a diagram in the model overview
-
Open the Properties via the context menu:

Layout properties
The following settings are available for freehand and/or BPMN diagrams in the Layout area.
Note: Different layout settings are available depending on the diagram type.

|
Property |
Description |
|---|---|
|
Edge corner layout |
Here you can set whether connectors have rounded or normal edge corners.
|
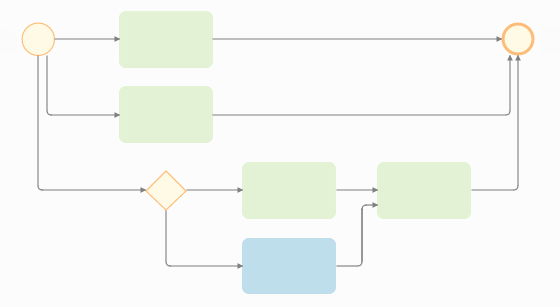
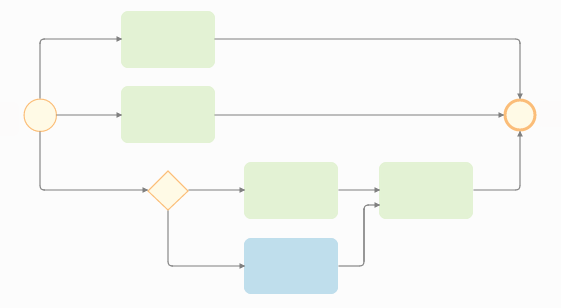
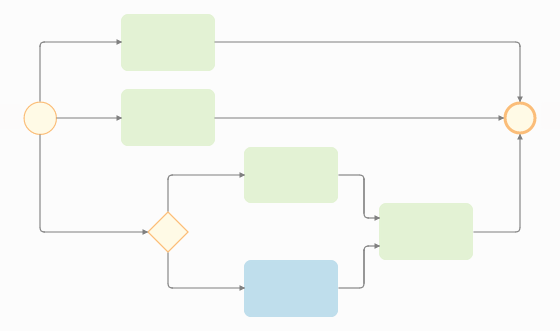
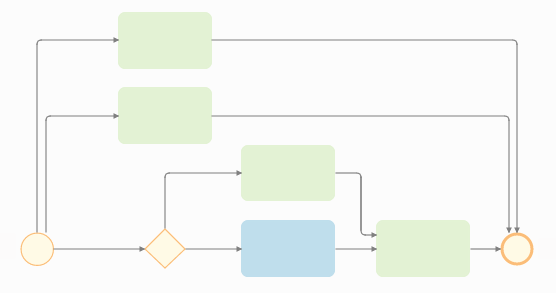
| Edge layout |
With this setting you determine how the connectors between shapes are drawn in freehand diagrams:
|
|
Horizontal |
|
|
Attribute lanes always horizontal |
|
|
Horizontal space |
Note: The attribute is intended for hierarchy diagrams. Hierarchy diagrams have already been discontinued. |
|
Vertical space |
Note: The attribute is intended for hierarchy diagrams. Hierarchy diagrams have already been discontinued. |
|
Show inputs and outputs |
See also: Show and hide input and output shapes |
|
Doc node for each input and output |
|
|
Doc node at relation |
See also: Model input/output flows |
|
Show input and output connections |
See also: Model input/output flows |
|
Layouter |
Here you set the version of the Auto-Layouter that automatically arranges the shapes in the diagram in an optimal way. See also: Modeling with the Auto-Layouter |
|
Edge labels on line |
See also: Label connector |
|
Use separate ports |
|
|
Optimize edges |
If you have set Layouter 5.3 or lower for the diagram, this property optimizes the edges of the shapes. |
|
With this setting you determine how the diagram flow should run:
Note: When the Aeneis 7.0 Layouter is active, the following lane styles are available:
|


Drawing settings
The following settings are available for freehand and/or BPMN diagrams in the Drawing settings area.
Note: Different drawing settings are available depending on the diagram type.

|
Property |
Description |
|---|---|
|
Gradient paint |
Here you define the background color of the diagram. A default background color is set for shapes whose background color you have not yet changed. |
|
Font color |
Here you define the font color of the diagram. For shapes whose font color you have not yet changed, a default font color is set. |
|
Font size |
Here you define the font size of the diagram and whether it is bold or italic. For shapes whose font size you have not yet changed, a default font size is set. |
|
Stroke color |
Here you define the line color of the diagram. For shapes whose line color you have not yet changed, a default line color is set. |
|
Stroke width |
Here you define the line width of the diagram in millimeters. For shapes whose line width you have not yet changed, a default line width is set. |
|
Transparency (0...100) |
Here you define the transparency of the diagram with a numerical value between 0% and 100%. Value 100: Diagram is displayed completely transparent. |
|
Zoom |
Here you set the initial zoom level of the diagram. Specify the zoom level in decimal numbers, where 1,0 = 100%. |
|
Permanent zoom |
Here you set the zoom level at which the diagram is displayed by default in the printout or print report. Specify the zoom level in whole numbers, where 1 = 100%. |
|
Details-present-fields |
|
|
Transparency on missing details |
|
|
Paper width |
Default value: 210 mm (DIN A4)
|
|
Paper height |
Default value: 297 mm (DIN A4)
|
|
Margin left |
|
|
Margin top |
|
|
Margin right |
|
|
Margin bottom |
|
|
View normal (vs. layout) |
Activated: Normal view Disabled: Layout view
|
|
Print footer |
Here you can set whether the footer should be printed when printing the diagram. If you change this setting in the print dialog, this setting will be taken into account for printing. If you save the settings of the print dialog via Save settings for print reports, the properties will be overwritten. |
|
Print header |
Here you can set whether the header should be printed when printing the diagram. If you change this setting in the print dialog, this setting will be taken into account for printing. If you save the settings of the print dialog via Save settings for print reports, the properties will be overwritten. |
|
Show comments |
See also: Insert comments at the shape |
|
Field to determine swimlane labels |
See also: Select field for swimlane label |
|
Show grid |
See also: Use grid |
|
Use grid |
See also: Use grid |
|
Grid size (mm) |
See also: Use grid |
| Align by objects |
If this property is activated, guides (lines) are displayed in the freehand diagram when you drag and drop shapes on the drawing area. This way you can align shapes with other shapes in the diagram and place them exactly at the same height as other shapes. See also: Use drawing guides |
| Align by distances |
If this property is activated, guides (lines) are displayed in the freehand diagram when you drag and drop shapes on the drawing area. This way you can align shapes with other shapes in the diagram so that their distances from each other are consistent. See also: Use drawing guides |
|
Number model objects only |
If numbers are displayed for shapes in the diagram, you can set this property to number only those shapes that have a model object. |

Note: The maximum height or width of charts is 32,000 px. Larger images are no longer displayed in the browser or via the Java-Script framework.
When generating a diagram as PNG, if there is not enough memory left on the server, the diagram will be displayed with a limited color palette.